실시간 metric 데이터를 수집 / 저장할 공간인 Prometheus를 설치한다.
Prometheus Architecture
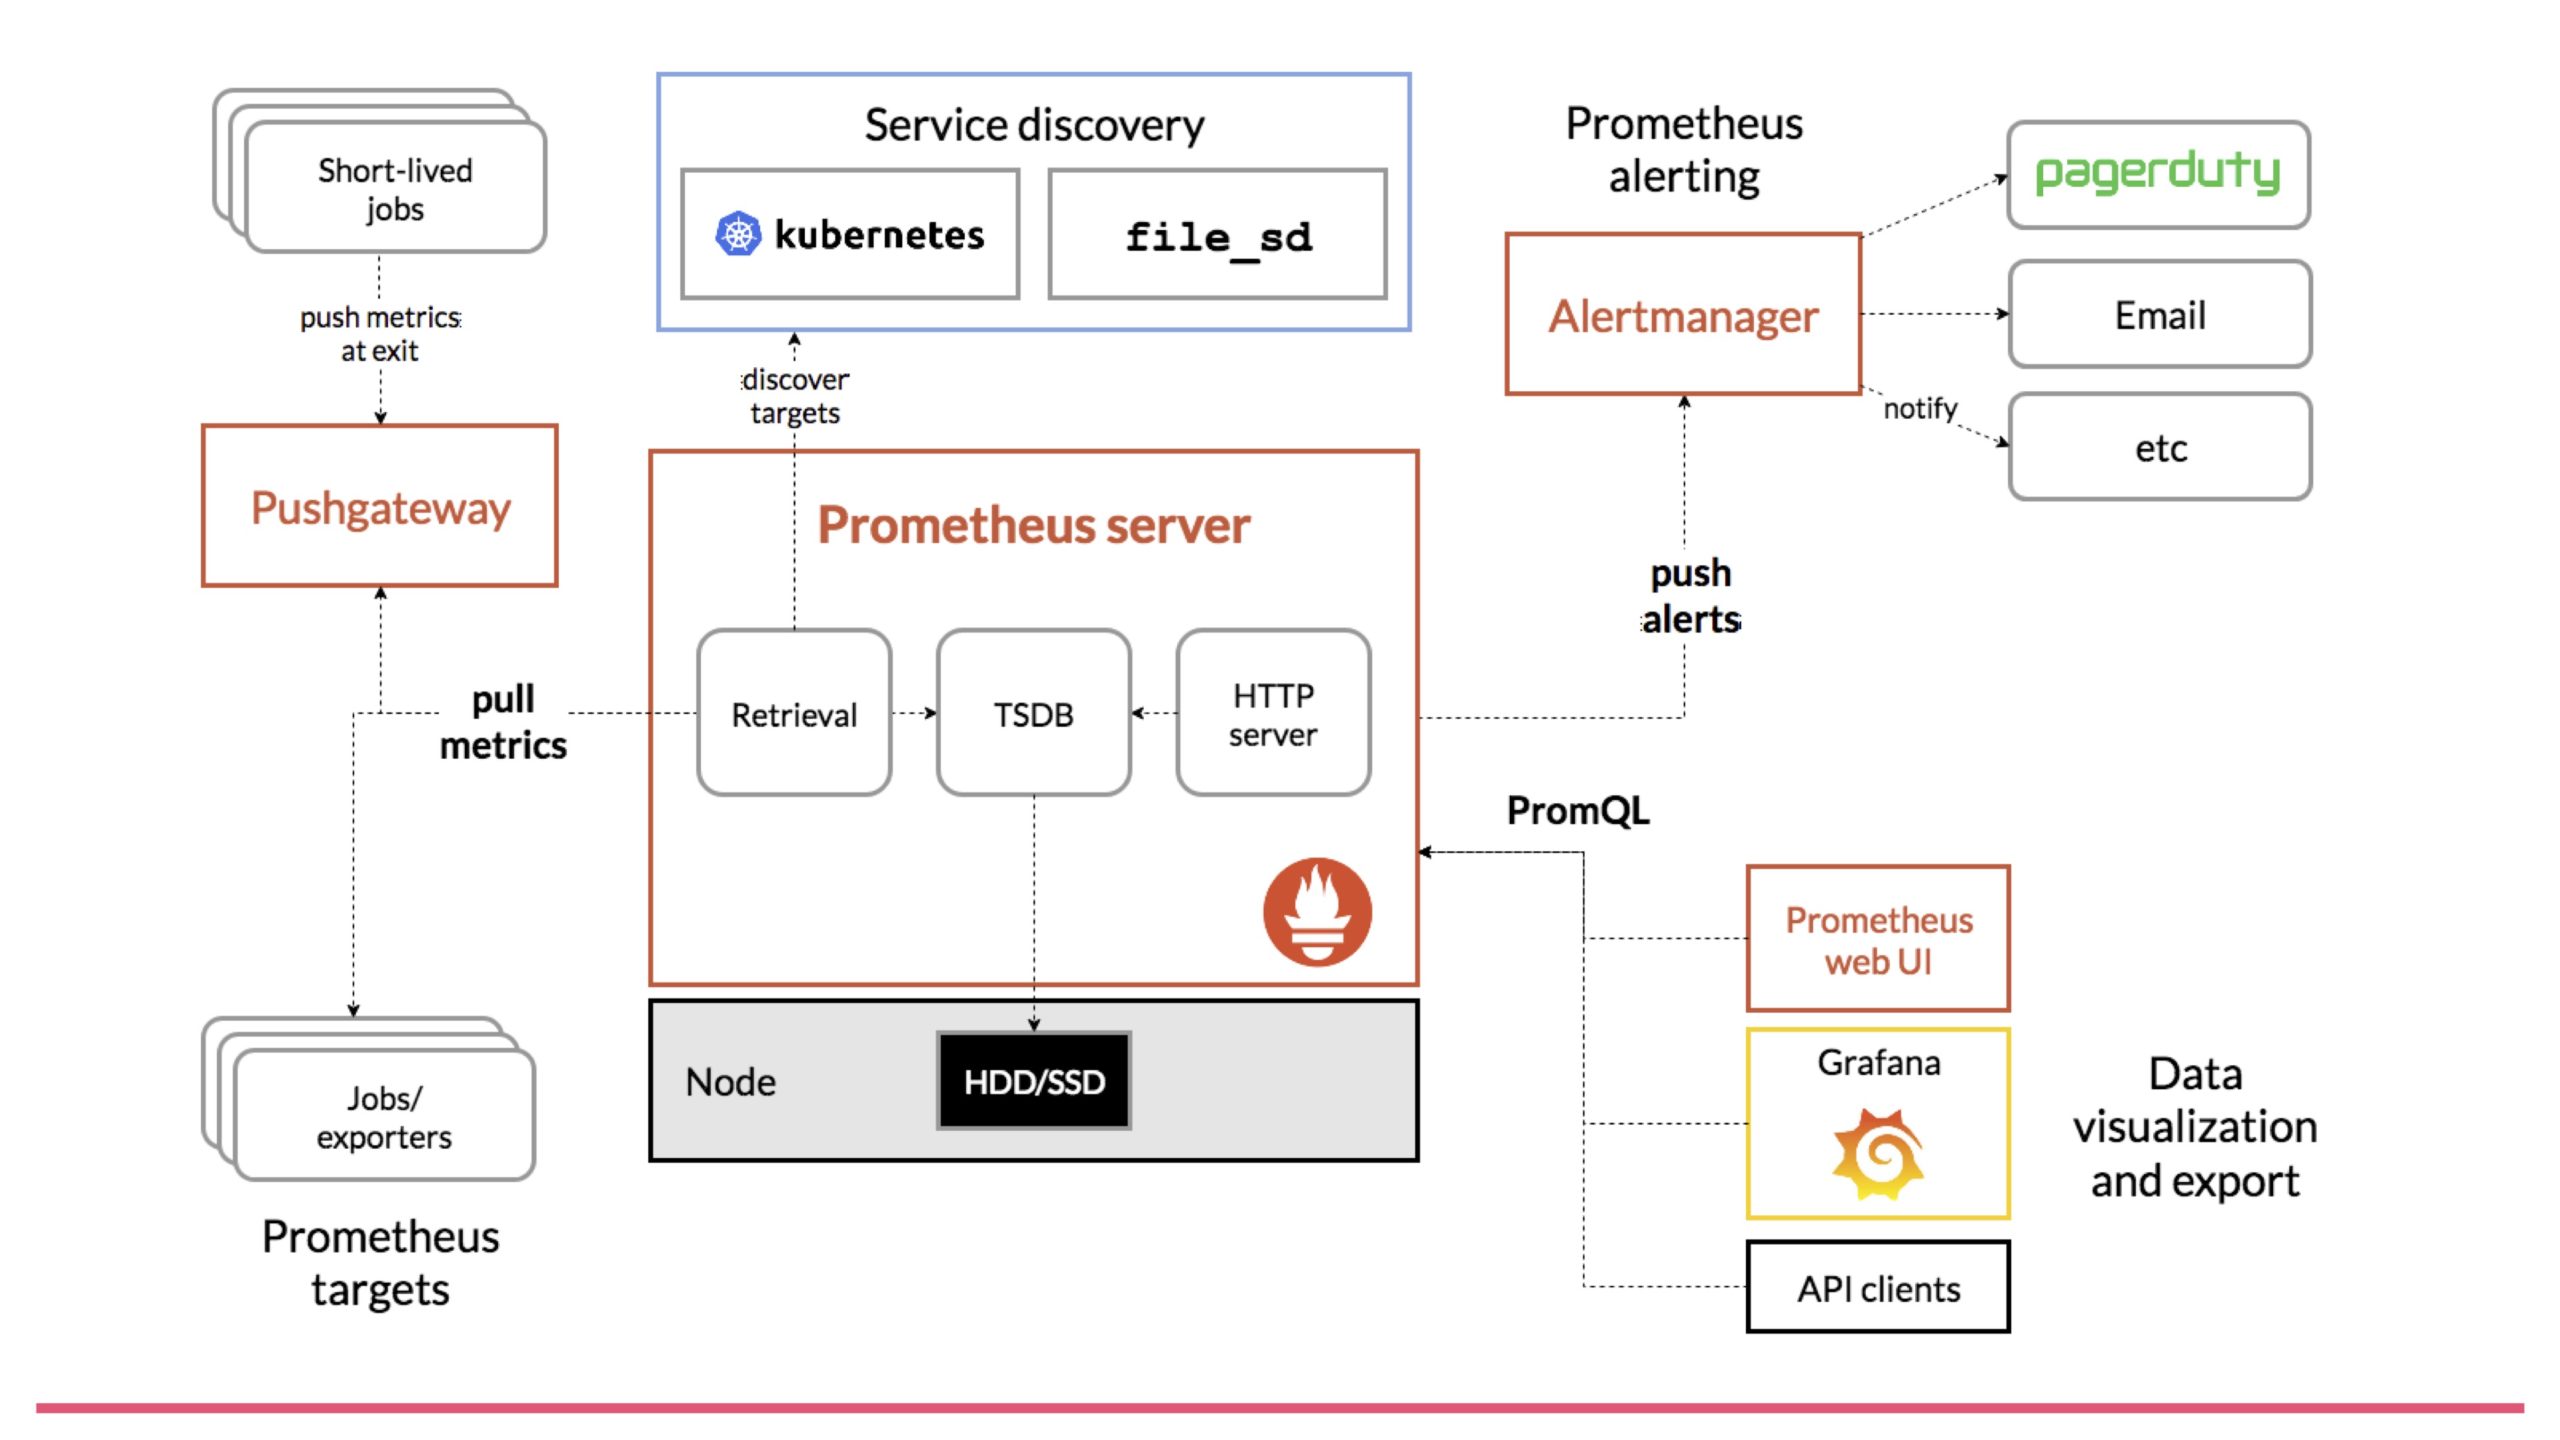
- Exporters : 감시 에이전트로 모니터링 대상에서 Metric을 수집하여 Prometheus가 읽을 수 있는 형태로 변환한다.
- TSDB : 시계열 데이터를 저장하는 저장소
- Service discovery
- 모니터링되는 정보를 자동으로 받아오는 구조
- 클라우드 플랫폼 또는 특정 소프트웨어 등의 해당 API를 주기적으로 호출하여, 거기에 등록된 인스턴스 정보를 수집한다.
- Alertmanager
- prometheus에서 설정한 Rule에 위배되는 이벤트를 전송받아 정해진 곳으로 전송한다.
- PromQL
- Prometheus Query Language의 약자
- 시계열 데이터와 매치되는 형태로 사용할 수 있다.
- Metric 라벨로 필터링이 가능하고 함수를 사용하여 집계를 수행하거나 경고를 실행하는 등의 동작이 가능하다.
Prometheus의 장점
- 600여개가 넘는 종류의 Exporter 지원하고 커스텀으로도 만들 수 있기 때문에 다양한 어플리케이션, 서버의 Metric을 손쉽게 수집할 수 있다.
- PromQL을 통해 조회가 가능하고 웹콘솔 / API를 이용해서 서빙이 가능.
- 그라파나 등과 통합하여 대쉬보드를 구성하는 것이 가능.
Prometheus의 단점
- 일정 주기로 Metric을 Pulling 해오는 방식이기 때문에 Pulling 간격 사이의 Metric은 잡아낼 수 없다.
- 수집된 데이터는 프로메테우스 내의 메모리와 로컬 디스크에 저장된다. 그러므로 데이터 양이 늘어날 수록 저장공간 (= 디스크)을 늘려야 한다.
- 구조상 이중화나 클러스터링이 불가능하다.(Thanos라는 오픈소스를 사용하면 프로메테우스 2개를 띄워서 같은 데이터를 동시에 저장하게 할 수 있는 듯 하다.)
Prometheus 설치
1. promethues 파일 다운로드
$ wget https://github.com/prometheus/prometheus/releases/download/v2.45.3/prometheus-2.45.3.linux-amd64.tar.gz2. 압축해제
$ tar xzvf prometheus-2.45.3.linux-amd64.tar.gz
$ mv prometheus-2.45.3.linux-amd64 prometheus-files
3. prometheus 유저 추가
$ sudo useradd --no-create-home --shell /bin/false prometheus4. 폴더 생성 및 소유자 변경
$ sudo mkdir /etc/prometheus
$ sudo mkdir /var/lib/prometheus
$ sudo chown prometheus:prometheus /etc/prometheus
$ sudo chown prometheus:prometheus /var/lib/prometheus
5. 바이너리 파일 이동 및 소유자 변경
$ sudo cp prometheus-files/prometheus /usr/local/bin
$ sudo cp prometheus-files/promtool /usr/local/bin
$ sudo chown prometheus:prometheus /usr/local/bin/prometheus
$ sudo chown prometheus:prometheus /usr/local/bin/promtool
6. 폴더 이동 및 소유자 변경
$ sudo cp -r prometheus-files/consoles /etc/prometheus
$ sudo cp -r prometheus-files/console_libraries /etc/prometheus
$ sudo chown -R prometheus:prometheus /etc/prometheus/consoles
$ sudo chown -R prometheus:prometheus /etc/prometheus/console_libraries
7. YAML 파일 설정
$ vi /etc/prometheus/prometheus.yml
==============================================================================================
global:
  scrape_interval: 10s

scrape_configs:
  - job_name: 'prometheus'
    scrape_interval: 5s
    static_configs:
      - targets: ['localhost:9090']
$ sudo chown prometheus:prometheus /etc/prometheus/prometheus.yml8. 프로메테우스 서비스 생성
$ sudo vi /etc/systemd/system/prometheus.service
===================================================================
[Unit]
Description=Prometheus
Wants=network-online.target
After=network-online.target

[Service]
User=prometheus
Group=prometheus
Type=simple
ExecStart=/usr/local/bin/prometheus \
    --config.file /etc/prometheus/prometheus.yml \
    --storage.tsdb.path /var/lib/prometheus/ \
    --web.console.templates=/etc/prometheus/consoles \
    --web.console.libraries=/etc/prometheus/console_libraries

[Install]
WantedBy=multi-user.target
9. 프로메테우스 서비스 start 및 자동시작 설정
$ sudo systemctl daemon-reload
$ sudo systemctl start prometheus
$ sudo systemctl enable prometheus

$ sudo systemctl status prometheus
EC2 inbound 규칙 수정
- 9090 포트 추가

Web UI 접속
- 접속주소 : http://<ec2 퍼블릭 IPv4 DNS >:9090/graph

참고
카프카 메트릭 모니터링(kafka + prometheus + Grafana) : https://medium.com/@rramiz.rraza/kafka-metrics-integration-with-prometheus-and-grafana-14fe318fbb8b
https://ksr930.tistory.com/270
[Kubernetes] Grafana 에서 Kafka 모니터링 하기 #Prometheus #kafka-exporter
[Kubernetes] Grafana에서 Kafka 모니터링하기 Kubernetes 에서 PLG 스택 사용해보기 라는 주제로 작년 10월쯤에 포스팅을 작성했었습니다. 그동안 팀에서진행 하는 프로젝트에도 많은 변화가 있었는데 Kafka
ksr930.tistory.com
프로메테우스 설치 : https://devopscube.com/install-configure-prometheus-linux/
How To Install and Configure Prometheus On a Linux Server
Prometheus is an open-source monitoring system which is very lightweight and has a good alerting mechanism. Install and
devopscube.com
프로메테우스 아키텍쳐 : https://www.devkuma.com/docs/prometheus/overview/
Prometheus의 특징과 아키텍처
Prometheus란? Prometheus(프로메테우스)는 SoundCloud라는 해외 음악 관련 서비스 엔지니어가 개발한 감시 시스템이다. 원래, Kubernetes의 전신이었던 Google의 내부에서 사용되고 있던 Borg(보그)라고 하는
www.devkuma.com
'실시간 데이터 수집' 카테고리의 다른 글
| 실시간 데이터 수집-5 (Filebeat 설치) (0) | 2024.03.10 |
|---|---|
| 실시간 데이터 수집-4 (Grafana 설치 및 Prometheus 연동) (1) | 2024.02.25 |
| 실시간 데이터 수집-2 (AWS에서 Confluent 설치) (1) | 2024.02.11 |
| 실시간 데이터 수집-1 (시나리오) (0) | 2024.02.11 |
| Confluent 구축 사양 체크 (1) | 2024.02.04 |


댓글